In November 2020, the Premier League’s “Big Six” had only recently signed up to a new European Super League and Project “Big Picture” was the talk of the industry.
At the time, we looked into the question of how far the “Big Six” had pulled away from the rest of the clubs in the Premier League. Despite the as-yet-unknown impact of a pandemic in its relatively early stages, all the data pointed to a widening gap between an elite group of clubs (Arsenal, Chelsea, Liverpool, Manchester City, Manchester United and Tottenham Hotspur) and the rest of the league. With the publication of 2020/21 accounts for all clubs, it is time to revisit this question and consider the impact of Covid-19 over 18 months later.
Dominance in decline?
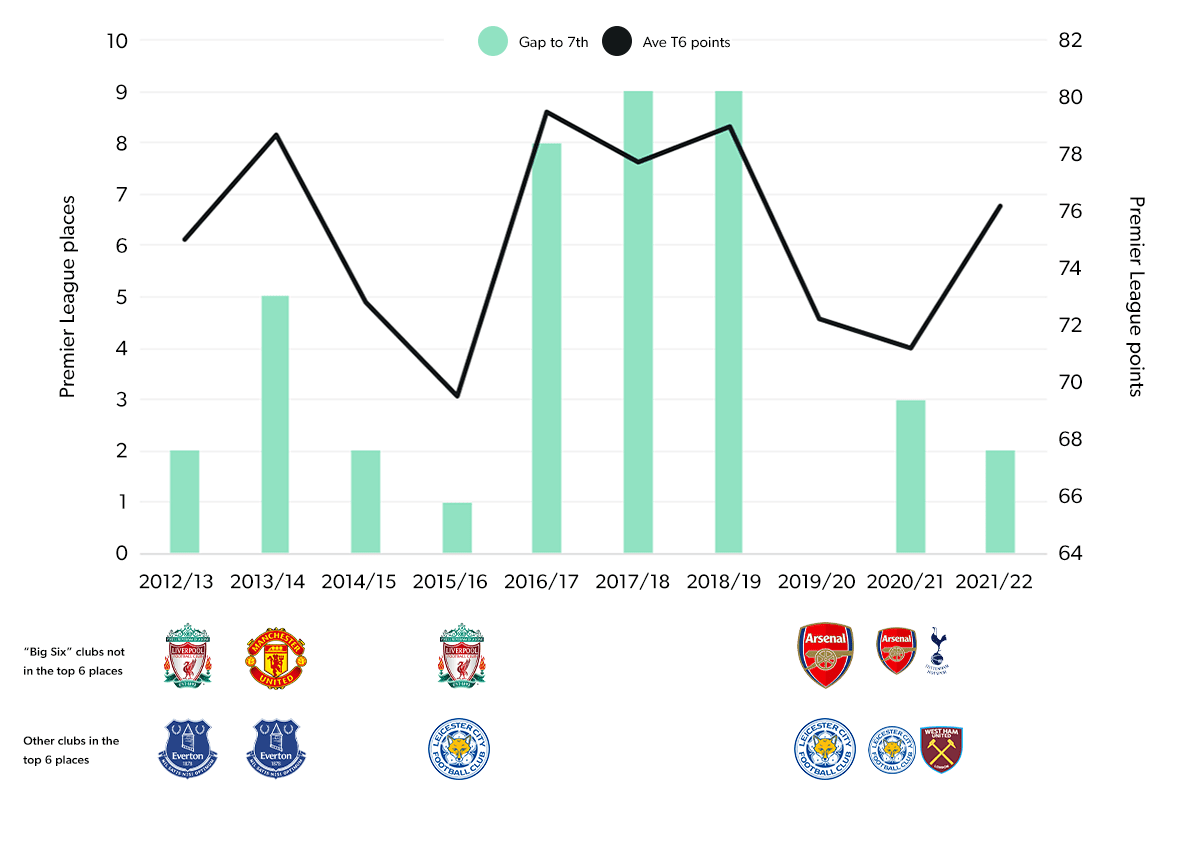
The first metric to consider is, of course, performance on the pitch. Back in November 2020, the previous decade had not only seen the formation of the “Big Six” but the cementing of their place as the Premier League’s top clubs, with only five instances of another club finishing in the top six across the 10 seasons. More notably, aside from the 2019/20 season which finished behind closed doors and arguably caused major disruption as teams adjusted to the lack of home advantage and depleted squads, a trend was developing in which the “Big Six” were not only “in a league of their own” but were opening up a significant gap of eight to nine points from the team placed seventh in the division, with an average of 79 league points.
The “Covid seasons” have seen this trend collapse. In the past three seasons the average points tally of the “Big Six” has fallen to 73 and the gap from sixth to seventh place to just 1.7 points on average. The 2020/21 season was the first in which two of this elite group (Tottenham Hotspur and Arsenal) finished outside of the top six places in 14 years (since Manchester City and Tottenham Hotspur did in 2007/08 and 2008/09).
After stretching wider over three years from 2016/17, the points gap to “Big Six” has narrowed
Points gap 6th to 7th and average “Big Six” points, Premier League 2012/13
Revenue disparity continues to grow, led by commercial
It has long been demonstrated that financial strength leads to success on the pitch. In the days of Financial Fair Play, a club’s ability to generate revenue has had a far greater bearing on its ability to invest in the assembly of a competitive squad – both in terms of acquiring players through the transfer market and paying the salaries required to attract and retain them. Covid-19 has been seen as the great leveller in that regard, with the Goliaths suffering alongside the Davids – perhaps even more considering the greater importance of matchday revenues to clubs with large stadia, high ticket prices and lucrative hospitality offerings (in the three seasons before the pandemic, "Big Six" matchday revenue accounted for 17.3% of turnover vs. just 8.3% for the rest of the league).
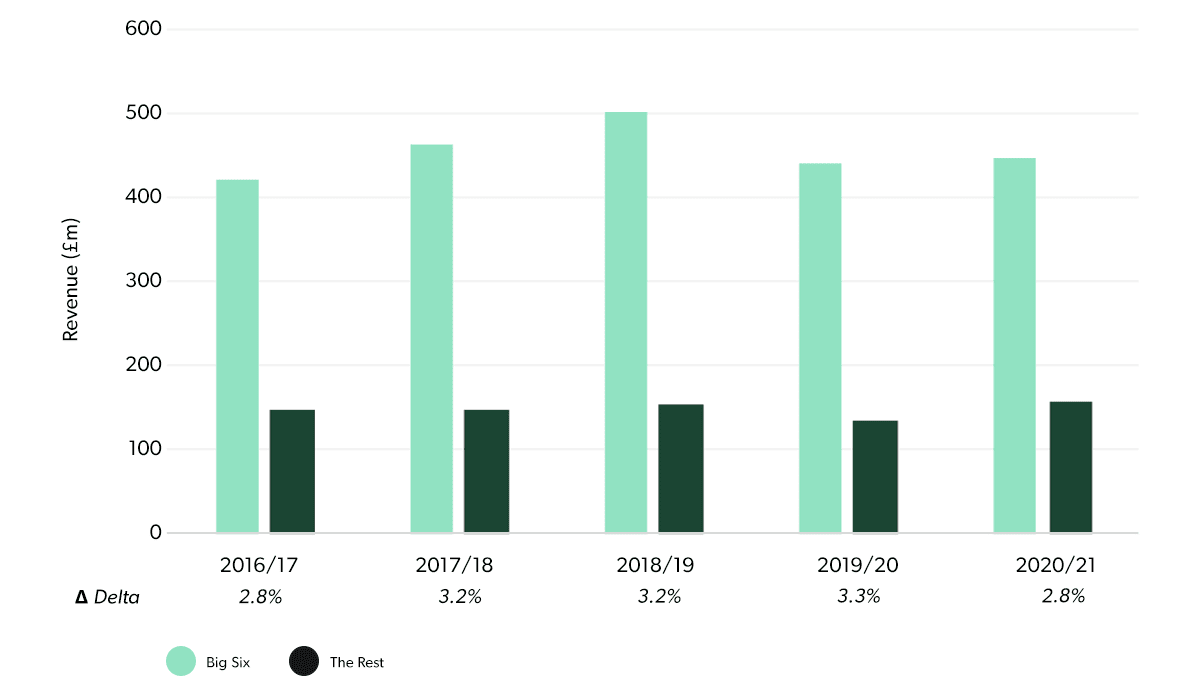
Looking at the accounts, we can see that the widening of the gap in total revenues has been checked somewhat in the 2020/21 season. From 2016/17 to 2019/20 the multiple of average "Big Six" club revenue to the rest of the league average grew from 2.8x (a delta in absolute of £271.8m) to 3.3x (£303.8m). In 2020/21 it fell back to 2.8x (£289.3m).
“Big Six” revenue gap narrowed in the 2020/21 season
Average club revenues, “Big Six” vs. rest of Premier League, 2016/17 to 2020/21, £m
A large part of this is related to lost matchday revenues, which impacted 2020/21 far more than the prior season – when the “Big Six” generated on average 6.5x the amount taken by other clubs. The 2020/21 season saw the bigger clubs collectively lose £469.7m (£78.3m per club) in matchday revenues vs. 2018/19 (the last season unaffected by Covid-19 restrictions), while the other 14 lost a little over a third of this amount (£176.6m, £12.6m per club) combined. At the height of the pandemic, questions were raised over the validity of a business model deriving such a significant share of revenues from sources which could be “switched off” with such immediate and dramatic effect.
The Premier League’s broadcasting deals, being the largest share of overall league revenues at 59.8% from 2016/17 to 2020/21 have been designed from the outset to promote competitiveness: average revenues from this source for the “Big Six” were 1.9x those of the rest of the league average in 2020/21. This does represent an increase from 1.6x in 2016/17 (driven largely by the revised distribution agreement for international revenues from 2019/20 onwards)however, this ratio remains significantly smaller than those of other revenue streams.
The biggest delta is in commercial revenue, where the biggest clubs can leverage the network effects of growing visibility and sponsorship revenue growth. Partnership agreements are built in part on levels of potential consumer reach through media and digital platforms, where growth is driven by on-pitch success and domestic and international marketing activation. While the “Big Six” did see a slight fall in commercial revenues of 4.4% vs. 2019/20 as claw-back clauses in sponsorship agreements kicked in, the combined total of £1.16bn still represented a growth of 21.6% over five years, increasing from 38.1% to 43.4% of total turnover. In 2020/21, “Big Six” commercial revenues averaged £193.9m, 9.0x the rest’s average of £21.5m.
The gap between “Big Six” and the rest is most pronounced in Commercial and Matchday revenues
Revenue multiple, “Big Six” vs. rest of Premier League, 2016/17 to 2020/21

Social media driving the disparity
As noted above, social media reach and audience engagement (along with that delivered by club websites and email databases) is vital in driving commercial revenues. Access to large global audiences in key demographics, as well as association with high-performance brands, are key factors for sponsors looking to build their brands (globally or in specific markets), and these audiences provide a receptive shopper base for online stores selling official club merchandise.
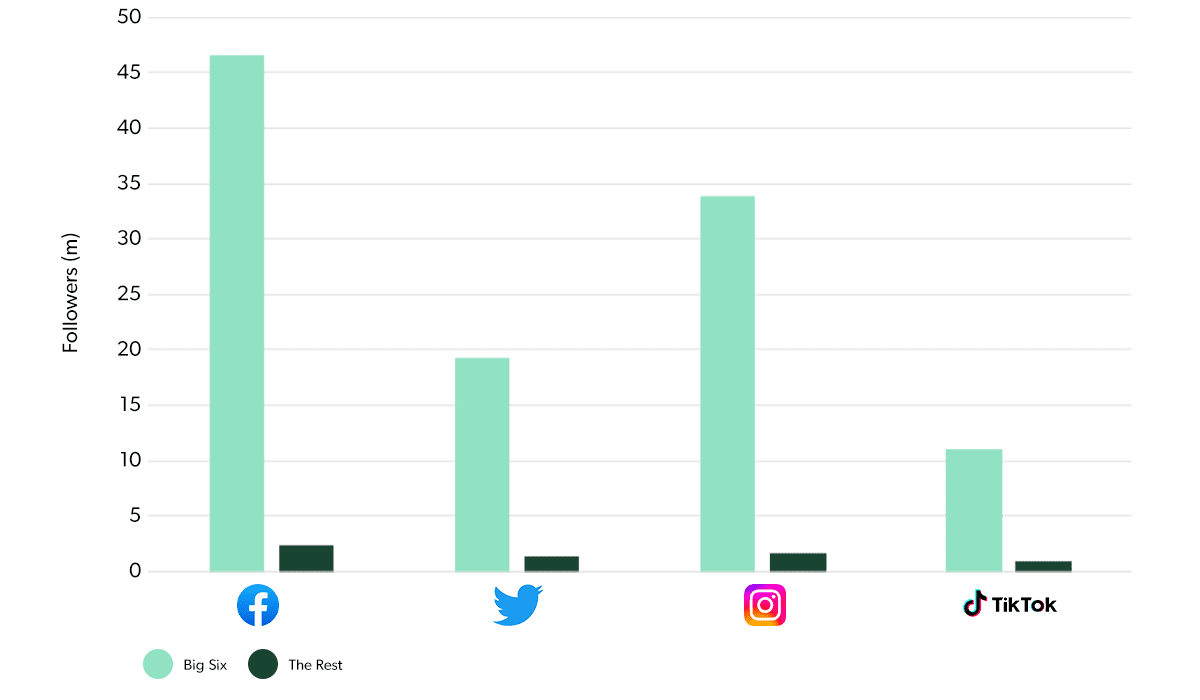
In terms of social media following, the “Big Six” tower over the rest of the clubs. Their average Facebook (46.6m) and Instagram (33.9m) followings are around 20x the rest of the league average, Twitter nearly 14x at 19.2m and TikTok nearly 12x at 11.0m. Importantly, the “Big Six” gap vs. the rest of the league average has widened significantly across the first three platforms since our report of November 2020, growing over 50% on Facebook and Twitter and over 75% on Instagram. Continued acceleration away from the pack at similar rates would help to create an unassailable moat of commercial potential around the “Big Six”, in a world where this new digital revenue streams and leveraging the global audience may develop into the most important for major clubs.
“Big Six” social media following continues to accelerate away from the rest of the Premier League
Social media following, “Big Six” vs. rest of Premier League, 2016/17 to 2020/21
The pandemic appears to have slowed the growth of the spending gap between the “Big Six” and the rest
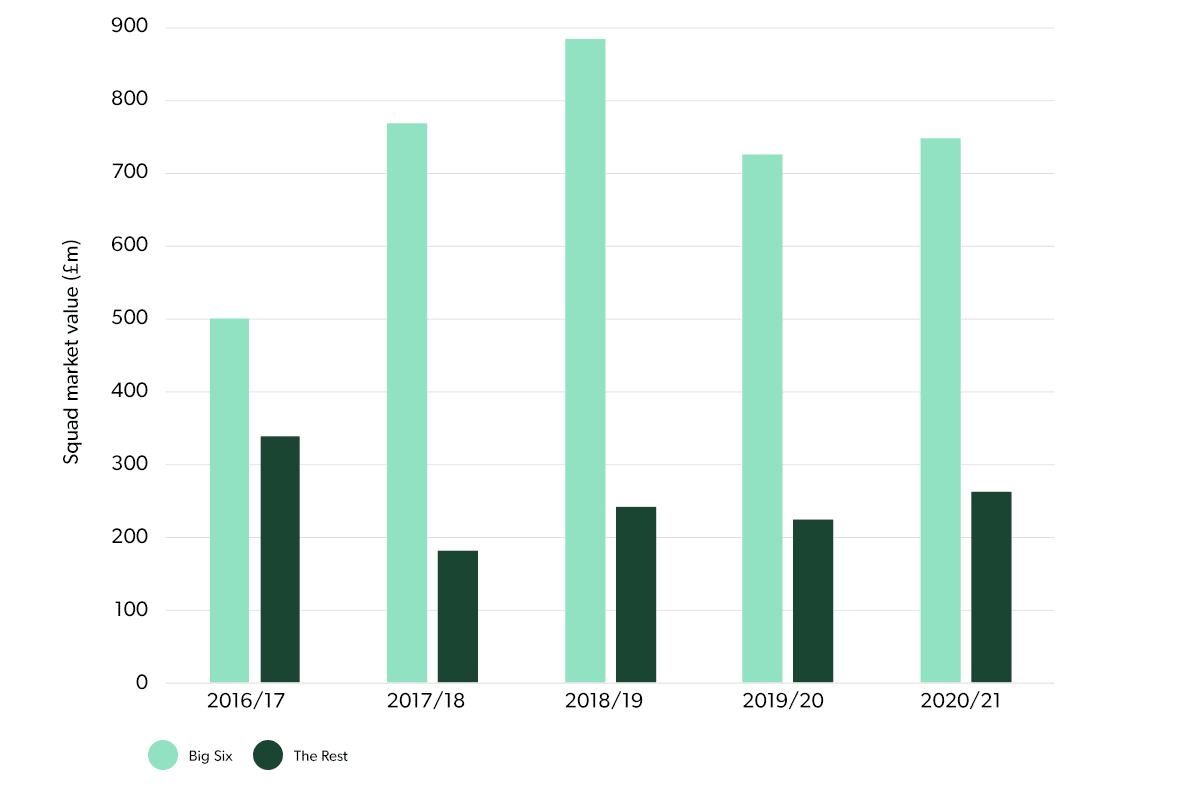
The player trading market has been disrupted by the impact of Covid-19, particularly in continental Europe where top-tier club finances have been under greater strain than those in England. Some clubs have been forced to sell players at lower valuations, although the wealth of the Premier League has meant fewer discounts have been available to English clubs. In the below chart, we can see that the average squad value of “Big Six” fell from a high of £885m in 2018/19 to £726m in 2019/20 (a fall of -18%), recovering slightly to £749m in 2020/21. The equivalent movement for average squad value amongst the other clubs in the division was £241m to £224m (a -7% drop) followed by a 17% growth to £262m. The gap between “Big Six” and the rest thus fell from £644m in 2018/19 to £488m in 2020/21, or from a factor of 3.7x to 2.9x.
The gap to “Big Six” squad value has fallen
Squad value, "Big Six" vs.rest of Premier League, 2016/17 to 2020/21
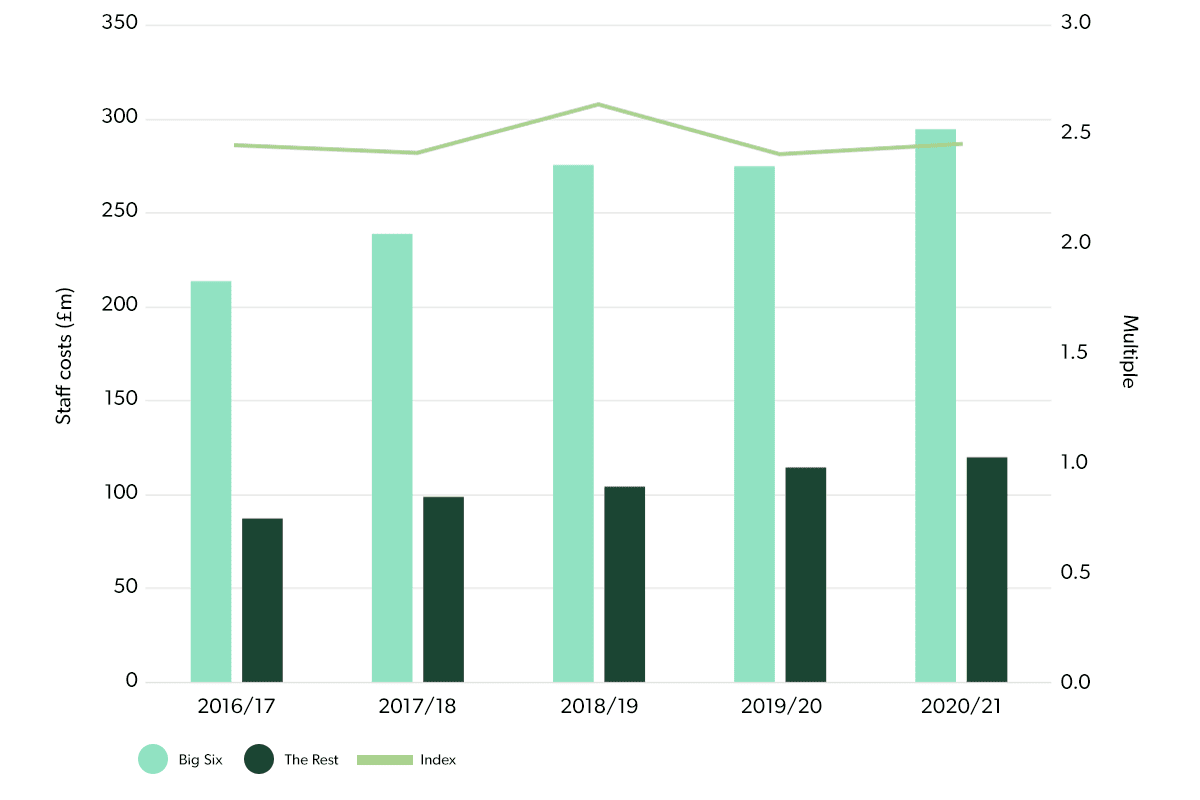
The gap in wage spend between the “Big Six” and the rest has remained fairly stable at around 2.5x. Staff costs had been growing at 14.4% per annum for the bigger clubs up to 2018/19, then stabilised in 2019/20 before growing more modestly at 7.0% in 2020/21. Meanwhile, the average wage bill amongst smaller clubs continued to grow throughout the period, albeit more steadily at an average of 9.4% per annum.
Wage spending has increased consistently for “Big Six” and the rest
Staff costs, Big Six vs. rest of Premier League, 2016/17 to 2020/21, £m
“Big Six” losses are on the rise
Despite the slowdown in expenditure growth, the “Big Six” posted average before-tax losses of £64.5m in 2020/21, an increase of 39.1% on the £46.4m losses of 2019/20. These clubs all posted profits in 2016/17 and 2017/18 (the latter average being £73.0m before tax), while in 2020/21 all posted losses except Manchester City with a BT profit of £5.0m.
“The rest” had slipped into losses on an average basis during 2018/19, led by Everton, and surpassed the “Big Six” in 2019/20 with before-tax losses of £51.0m. Contrary to their larger counterparts they have, however, achieved a significant reduction in losses on average, cutting these by 63.1% to £18.8m loss before tax.
Post-Covid, “Big Six” profitability is recovering more slowly than for smaller clubs
Club profit/loss before tax, “Big Six” vs. rest of Premier League, 2016/17 to 2020/21

Key outtakes
- The pandemic has certainly taken a toll on Premier League clubs, hitting those with big stadia the hardest as substantial matchday revenues were wiped out, particularly in 2020/21
- However, while some gaps between the P&Ls are no longer widening as rapidly, the “Big Six” have borrowed to protect competitiveness and rapid follower growth continues to propel them away from the rest of the league. The coming seasons may see these strengths pay major dividends and the gap start to widen again.